File list
This special page shows all uploaded files.
| Date | Name | Thumbnail | Size | Description | Versions |
|---|---|---|---|---|---|
| 01:23, 6 June 2015 | Bullseye.jpg (file) |  |
117 KB | Used as a warning symbol in upper left of "table" used to outline the point. | 1 |
| 20:27, 8 June 2015 | Covering circle.jpg (file) |  |
72 KB | Red circles have a radius equal to the distance between A and B. Points in green region are: * Outside circle that has AB as a diameter * Closer to A than B * Closer to B than A | 1 |
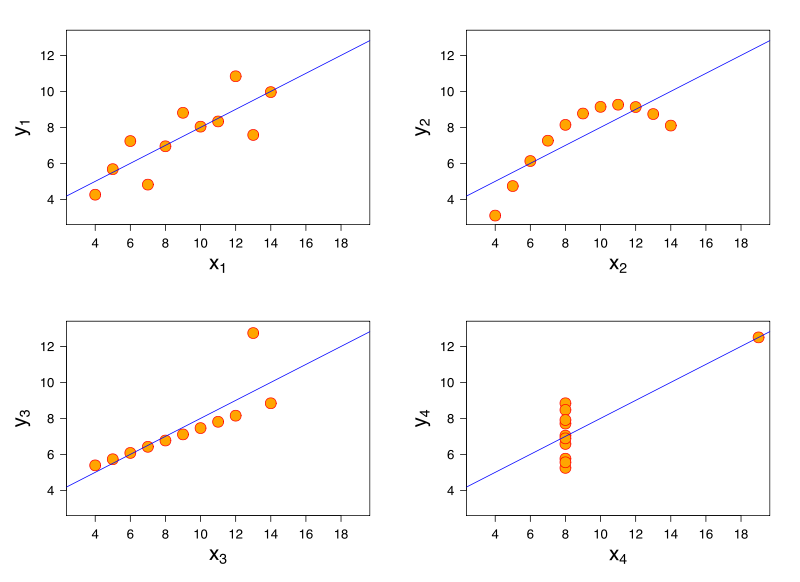
| 01:32, 11 June 2015 | 800px-Anscombe's quartet 3.png (file) |  |
38 KB | The four sets of points, [http://en.wikipedia.org/wiki/Anscombe%27s_quartet Anscombe's quartet}, have the same fit line and the same coreelation coefficient. Image from Wikipedia. http://en.wikipedia.org/wiki/File:Anscombe%27s_quartet_3.svg | 1 |
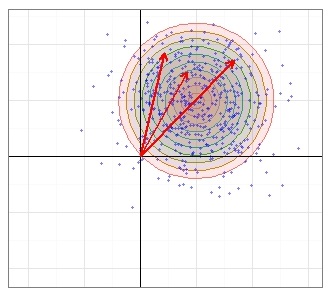
| 16:15, 11 June 2015 | Hoyt.jpg (file) |  |
34 KB | Shows distribution of shots around COI <math>\sigma_h \neq \sigma_v\text{, } \rho \neq 0<math | 1 |
| 16:16, 8 June 2015 | Raleigh.jpg (file) |  |
33 KB | Shot a radial shot pattern around the COI. Ideally the COI would be at the POA. | 1 |
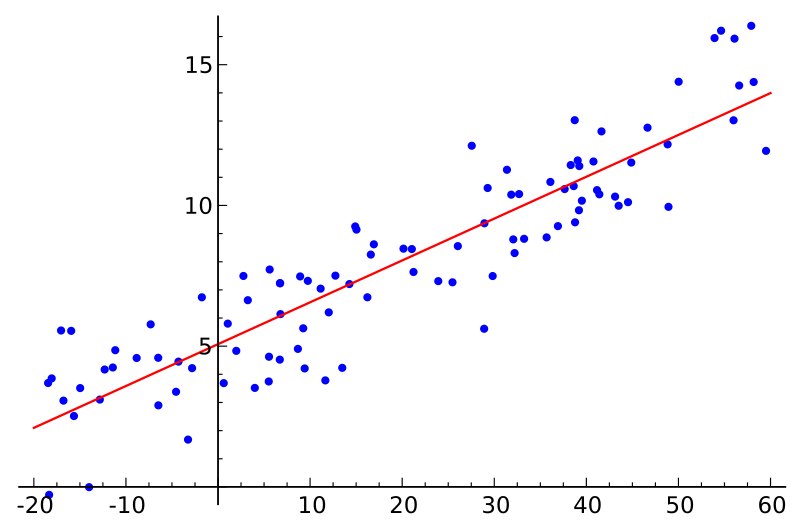
| 18:06, 9 June 2015 | 800px-Linear regression.png (file) |  |
31 KB | from wikipedia... http://commons.wikimedia.org/wiki/File:Linear_regression.svg | 1 |
| 18:30, 11 June 2015 | Rice.jpg (file) |  |
30 KB | Rice distribution for distances to POA. Shots circular about COI, but each shot measured to offset POA. | 1 |
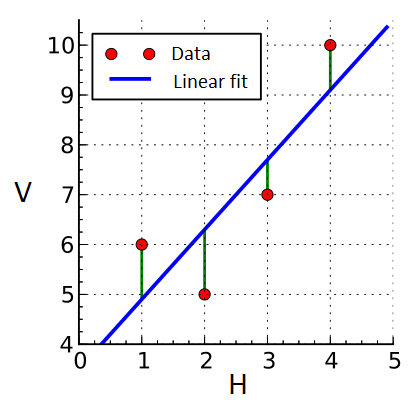
| 18:13, 9 June 2015 | Linear least squares example.png (file) |  |
24 KB | modified from wikipedia file. The data is the set of points marked by red dots. Blue line is least squares fit line. "Residuals" to fit shown in green. | 1 |
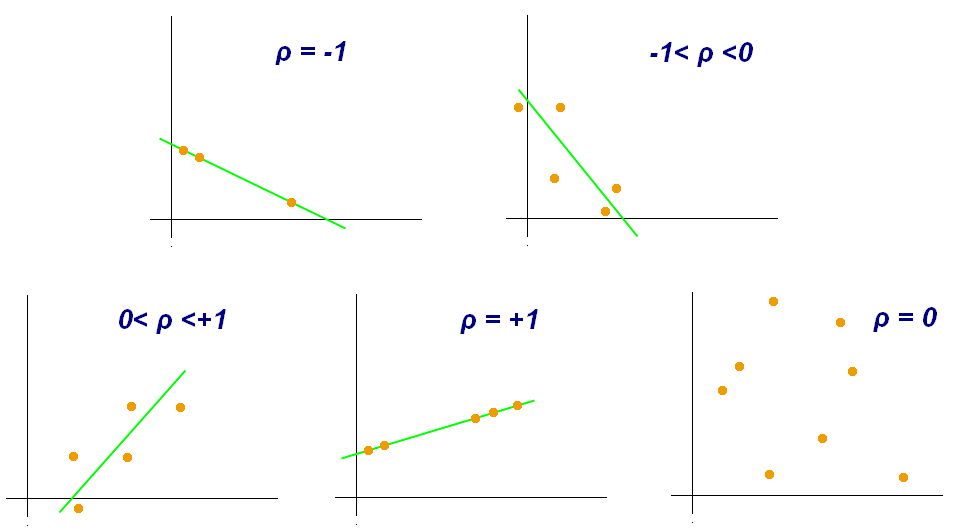
| 19:00, 9 June 2015 | Correlation coefficient.png (file) |  |
9 KB | some examples of correlation coefficients. Image from Wikipedia. http://en.wikipedia.org/wiki/File:Correlation_coefficient.png | 1 |