File list
This special page shows all uploaded files.
| Date | Name | Thumbnail | Size | User | Description | Versions |
|---|---|---|---|---|---|---|
| 15:24, 30 November 2014 | ES Quantiles.c (file) | 4 KB | David | 2 | ||
| 21:03, 18 March 2014 | RayleighEstimatorQuantile.c (file) | 5 KB | David | Simulate shots from a symmetric bivariate to calculate Rayleigh estimate of sigma and output quantile function (in steps of 0.5%) of estimated sigma for each sample size 2-50. | 1 | |
| 16:20, 30 November 2014 | SymBiSampleRanges.c (file) | 6 KB | David | 2 | ||
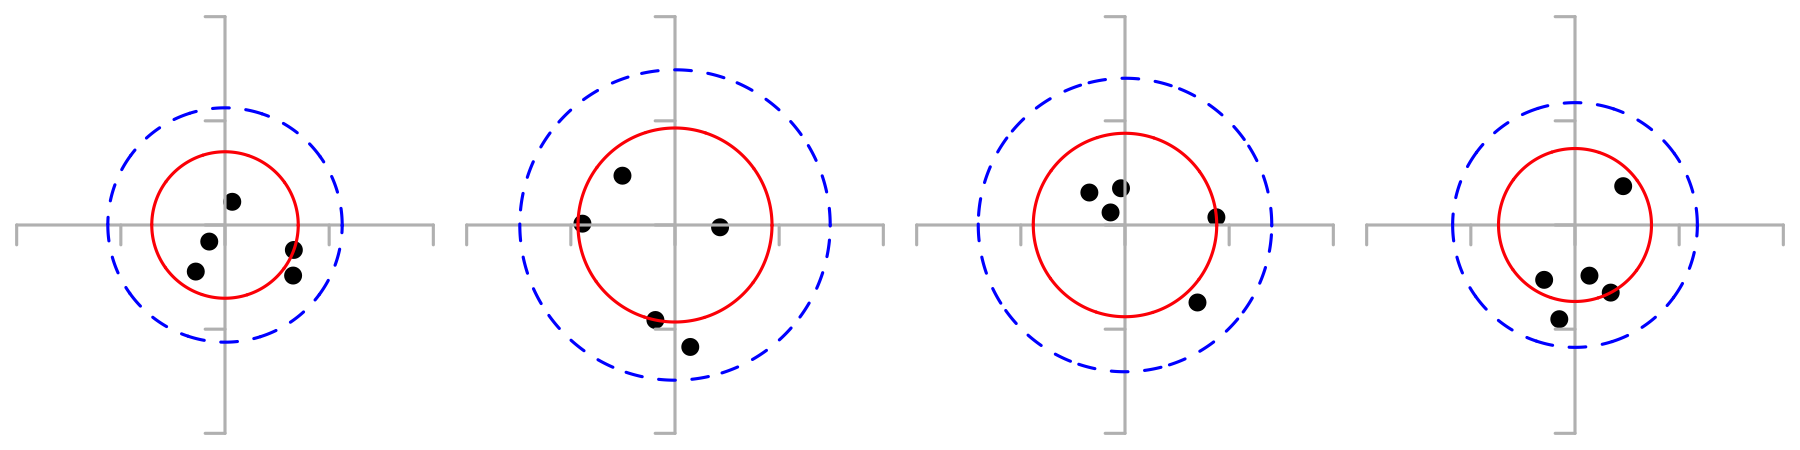
| 14:18, 18 November 2013 | PrecisionVsAccuracy2.png (file) |  |
7 KB | David | 1 | |
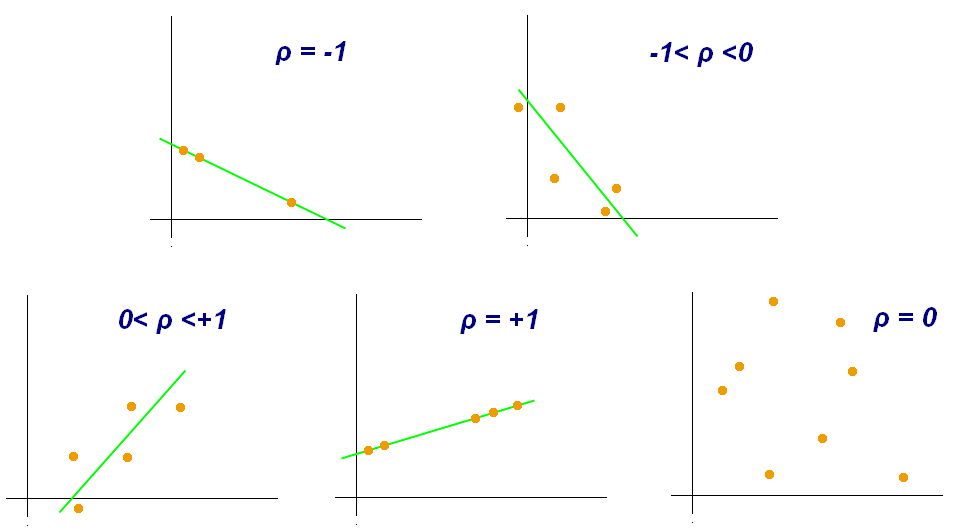
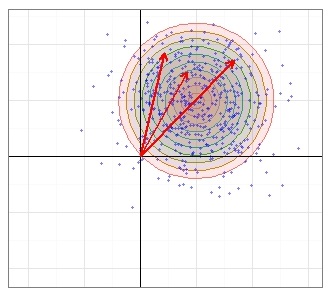
| 19:00, 9 June 2015 | Correlation coefficient.png (file) |  |
9 KB | Herb | some examples of correlation coefficients. Image from Wikipedia. http://en.wikipedia.org/wiki/File:Correlation_coefficient.png | 1 |
| 18:04, 30 November 2014 | SymmetricBivariate.c (file) | 11 KB | David | 4 | ||
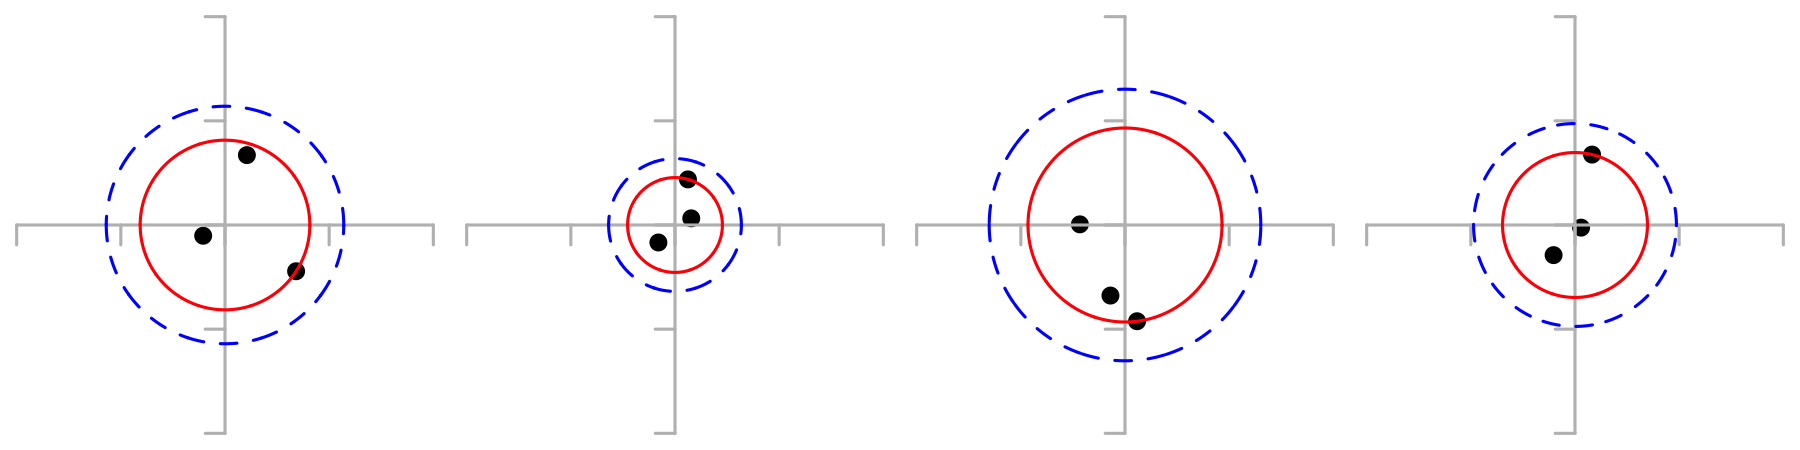
| 18:12, 18 May 2023 | PrecisionVsAccuracy.png (file) |  |
12 KB | David | Reverted to version as of 13:14, 18 November 2013 (EST) | 3 |
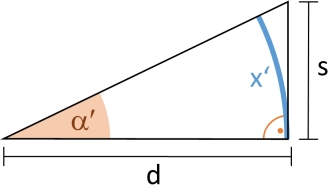
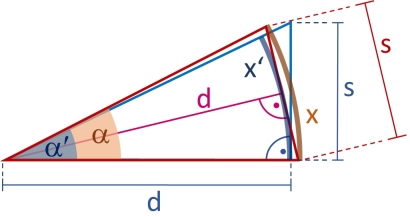
| 16:34, 20 January 2014 | AnglesSit.jpg (file) |  |
14 KB | Armadillo | 1 | |
| 18:54, 2 June 2014 | DanielsonExample.xlsx (file) | 14 KB | David | Small error fix. | 2 | |
| 09:59, 7 January 2014 | 2D ES Example.png (file) |  |
14 KB | David | Example of two targets with the same Extreme Spread but different Mean Radius. | 1 |
| 12:58, 25 November 2013 | ShotStatWiki.png (file) |  |
15 KB | David | Standard load development target. | 1 |
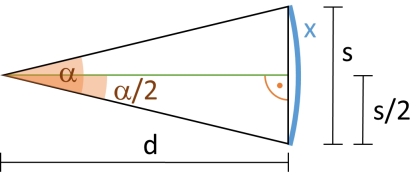
| 16:33, 20 January 2014 | AnglesCenter.jpg (file) |  |
19 KB | Armadillo | 1 | |
| 18:04, 30 November 2014 | Sigma1ShotStatistics.ods (file) | 20 KB | David | 2 | ||
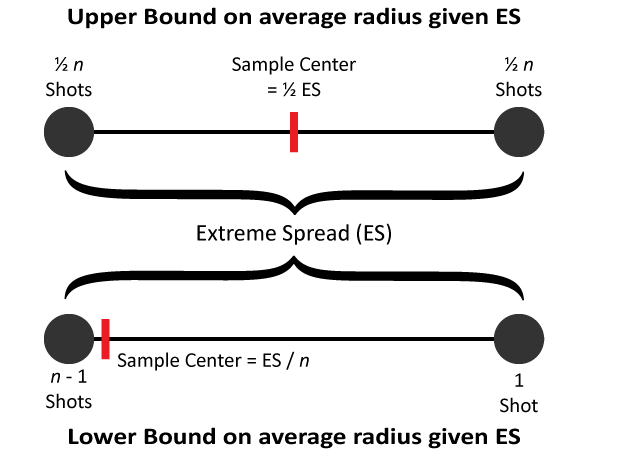
| 13:52, 27 November 2013 | RadiusBounds.png (file) |  |
21 KB | David | 2 | |
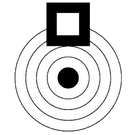
| 16:34, 20 January 2014 | AnglesCircle.jpg (file) |  |
21 KB | Armadillo | 1 | |
| 15:26, 2 January 2014 | 300BLK Subsonic Target w MV Adjustment.png (file) |  |
22 KB | David | Overlay of two target series: 1 - Raw shots of 20 Subsonic Remington Express .300BLK rounds at 100 yards. 2 - Same shots adjusted by rank for measured muzzle velocity. See data in File:300BLK 220gr Factory Subsonic 100yd.xlsx. | 1 |
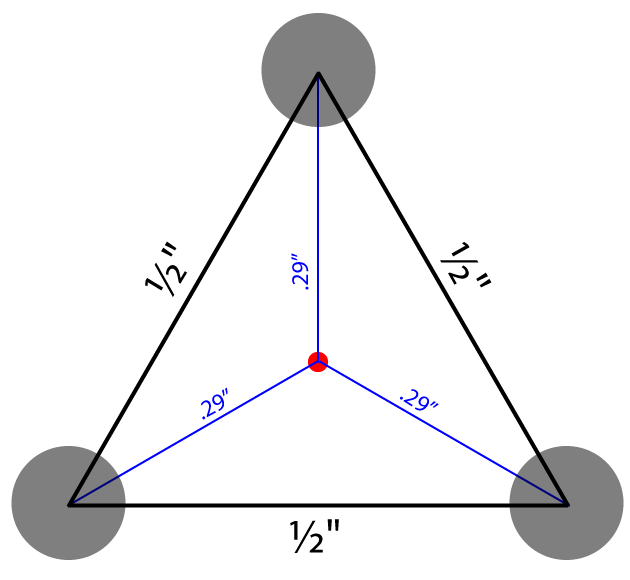
| 12:42, 27 November 2013 | 3ShotSample.png (file) |  |
22 KB | David | Sample 3-shot group with 1/2" extreme spread. Sample center is in red and is .29" from each shot. | 1 |
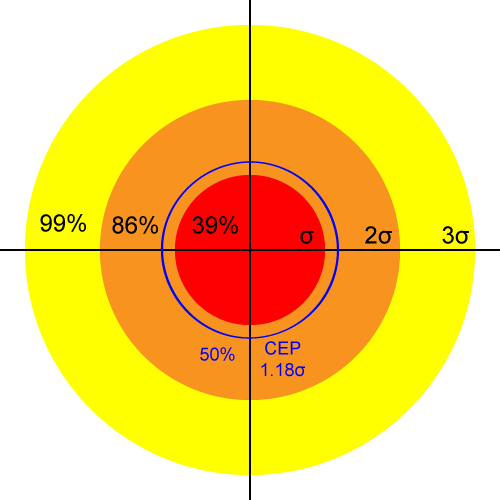
| 20:11, 26 November 2013 | RayleighProcess.png (file) |  |
22 KB | David | Fixed CEP coefficient | 2 |
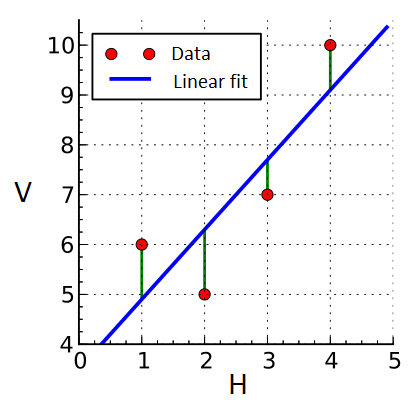
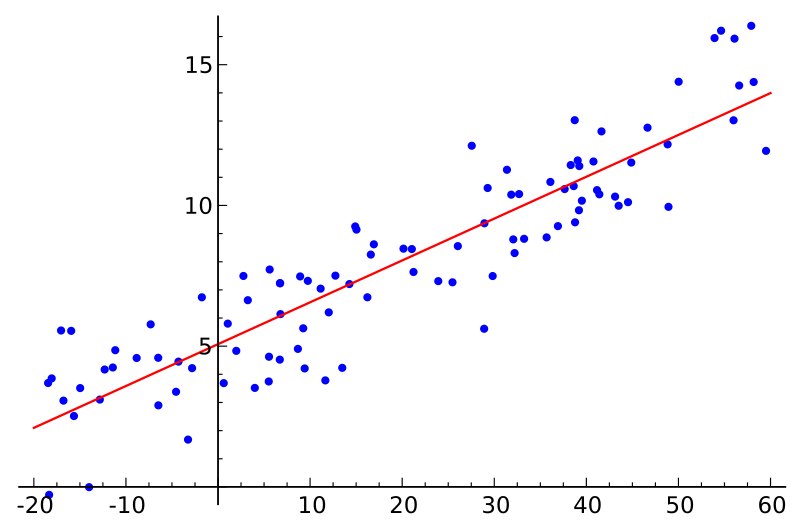
| 18:13, 9 June 2015 | Linear least squares example.png (file) |  |
24 KB | Herb | modified from wikipedia file. The data is the set of points marked by red dots. Blue line is least squares fit line. "Residuals" to fit shown in green. | 1 |
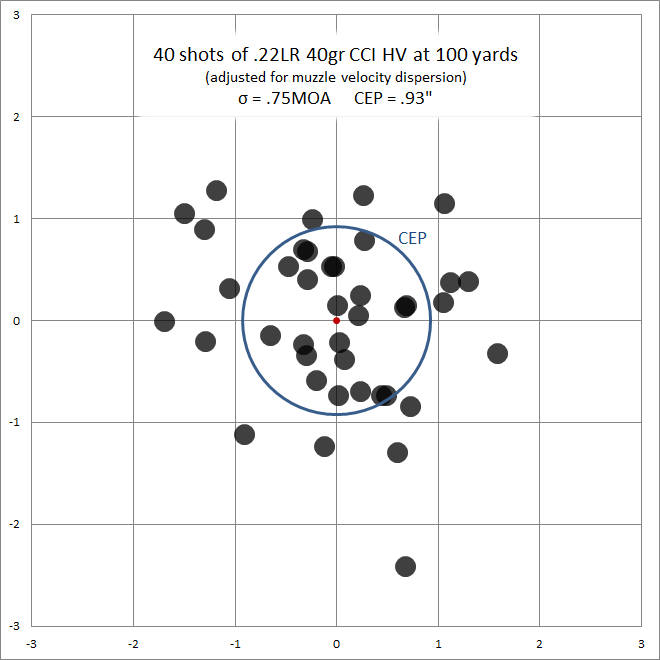
| 11:05, 13 December 2013 | 22LR CCI 40gr HV 40shot.png (file) |  |
25 KB | David | Results of analysis in File:CCI 40gr HV 100yd.xlsx of 40 shots (across two strings) of 22LR CCI 40gr HV, adjusted for sample muzzle velocity dispersion. | 1 |
| 17:44, 3 February 2014 | 300BLK 225gr IMR4227 subsonic 100yd.xlsx (file) | 27 KB | David | 300BLK Subsonic 60-shot 100-yard Example | 1 | |
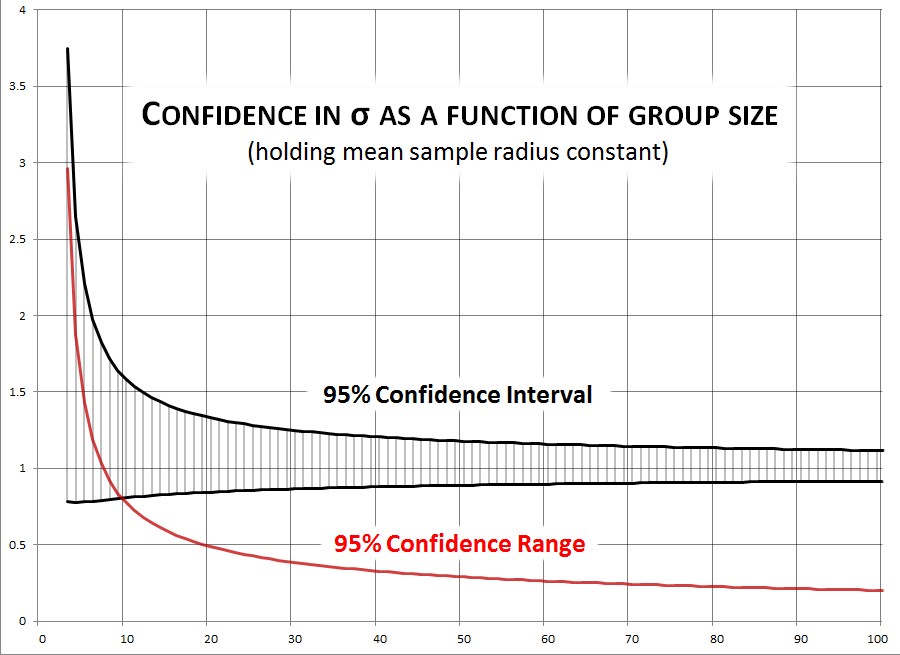
| 22:41, 30 November 2013 | ConfidenceIntervals.png (file) |  |
28 KB | David | Confidence Intervals and Range as a function of sample size, holding sample radius constant. | 1 |
| 19:20, 30 November 2013 | SCAR17 150gr 100yd.xls (file) | 29 KB | David | Data and calculations for File:SCAR17 150gr 100yd.png. | 1 | |
| 16:34, 20 January 2014 | AnglesCmp.jpg (file) |  |
30 KB | Armadillo | 1 | |
| 18:30, 11 June 2015 | Rice.jpg (file) |  |
30 KB | Herb | Rice distribution for distances to POA. Shots circular about COI, but each shot measured to offset POA. | 1 |
| 18:06, 9 June 2015 | 800px-Linear regression.png (file) |  |
31 KB | Herb | from wikipedia... http://commons.wikimedia.org/wiki/File:Linear_regression.svg | 1 |
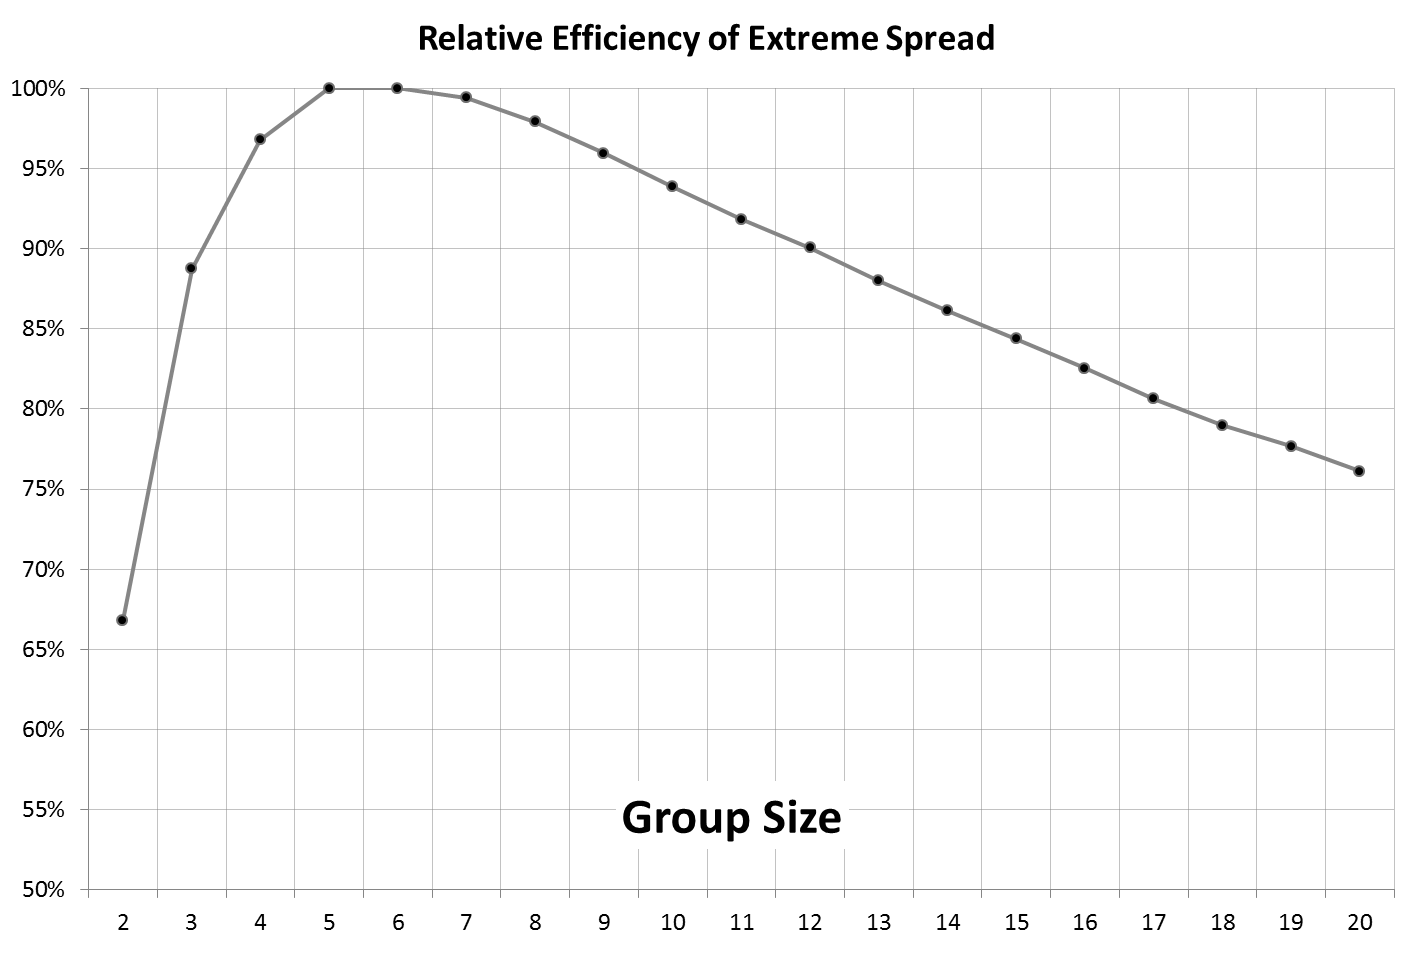
| 11:38, 25 May 2014 | Extreme Spread Relative Efficiency.png (file) |  |
33 KB | David | Relative Efficiency of Extreme Spread estimation by group size. | 1 |
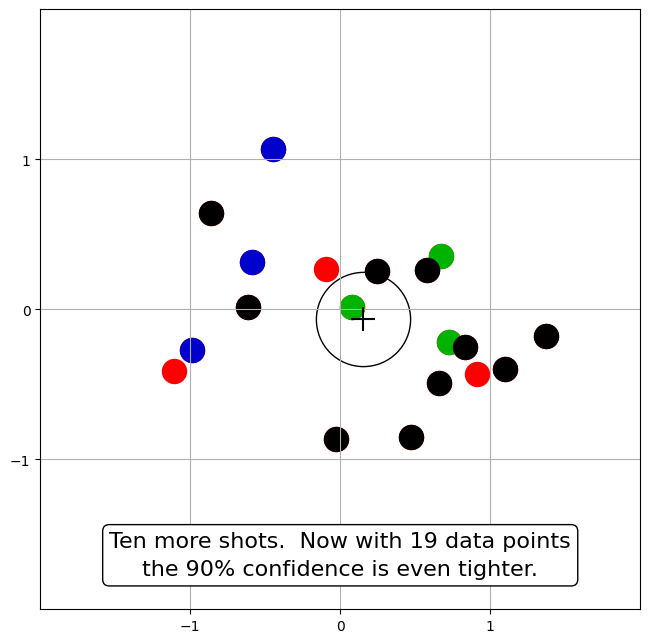
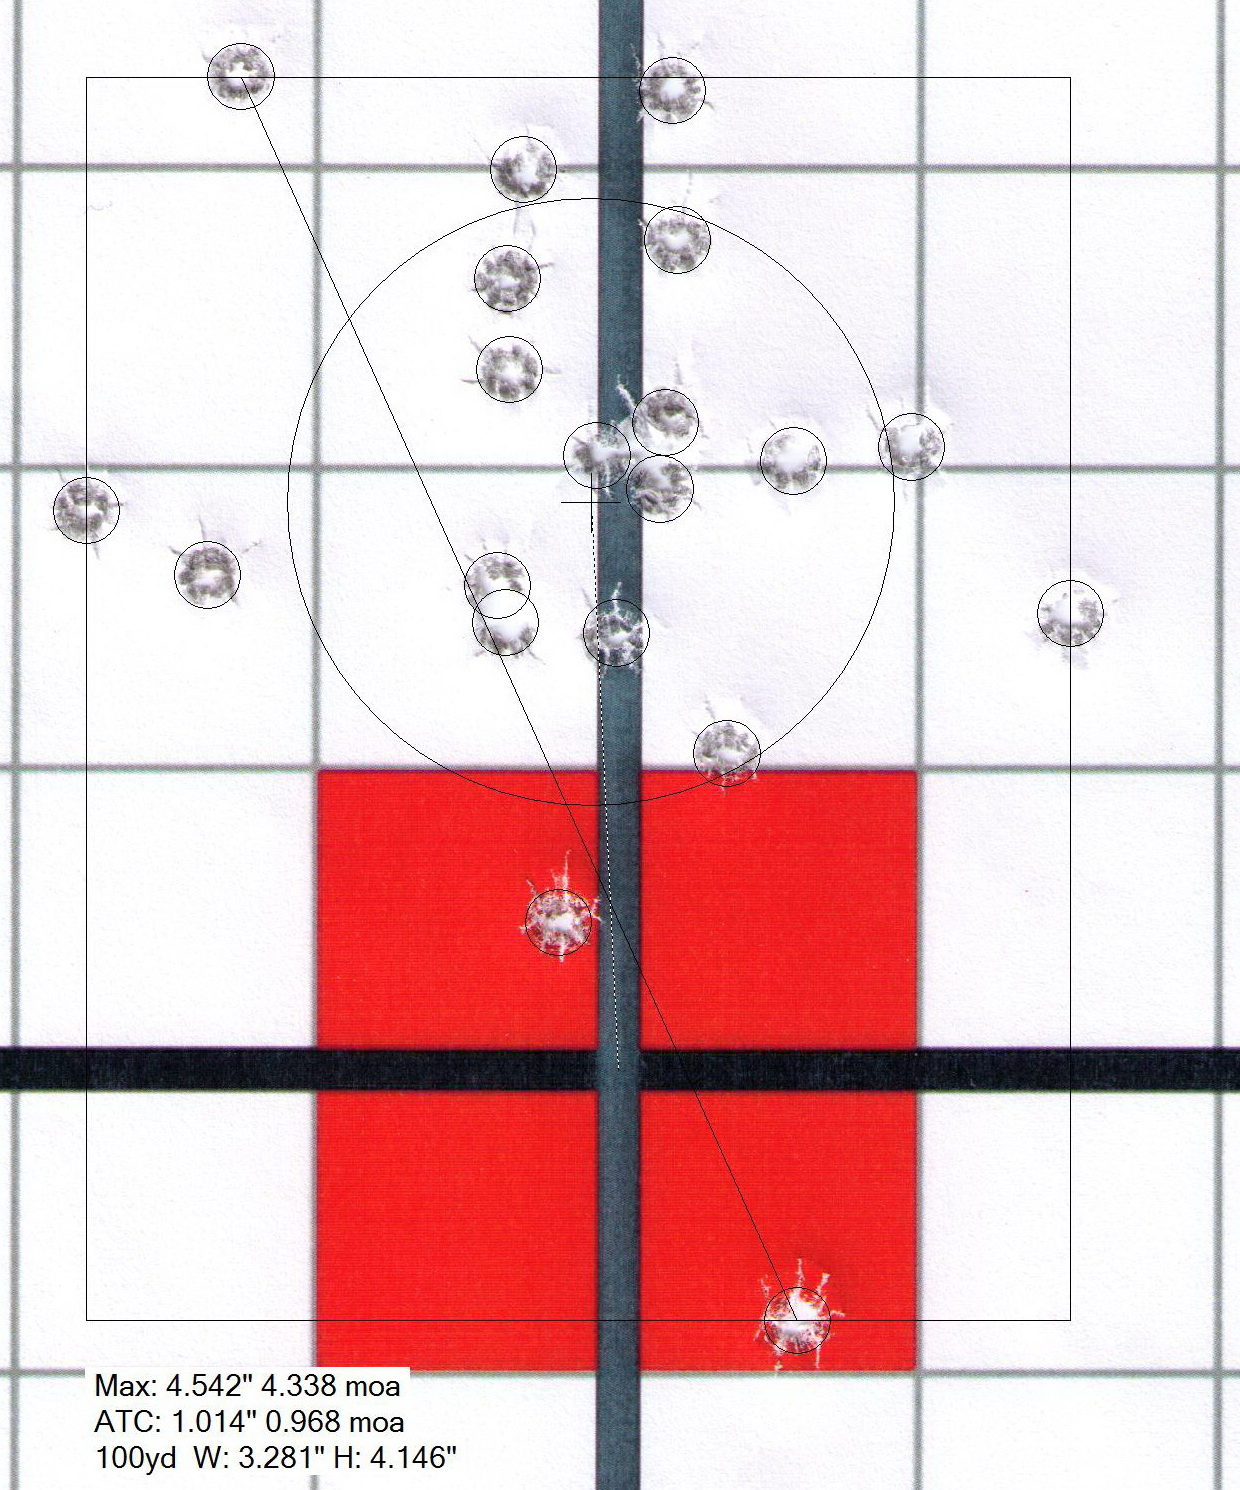
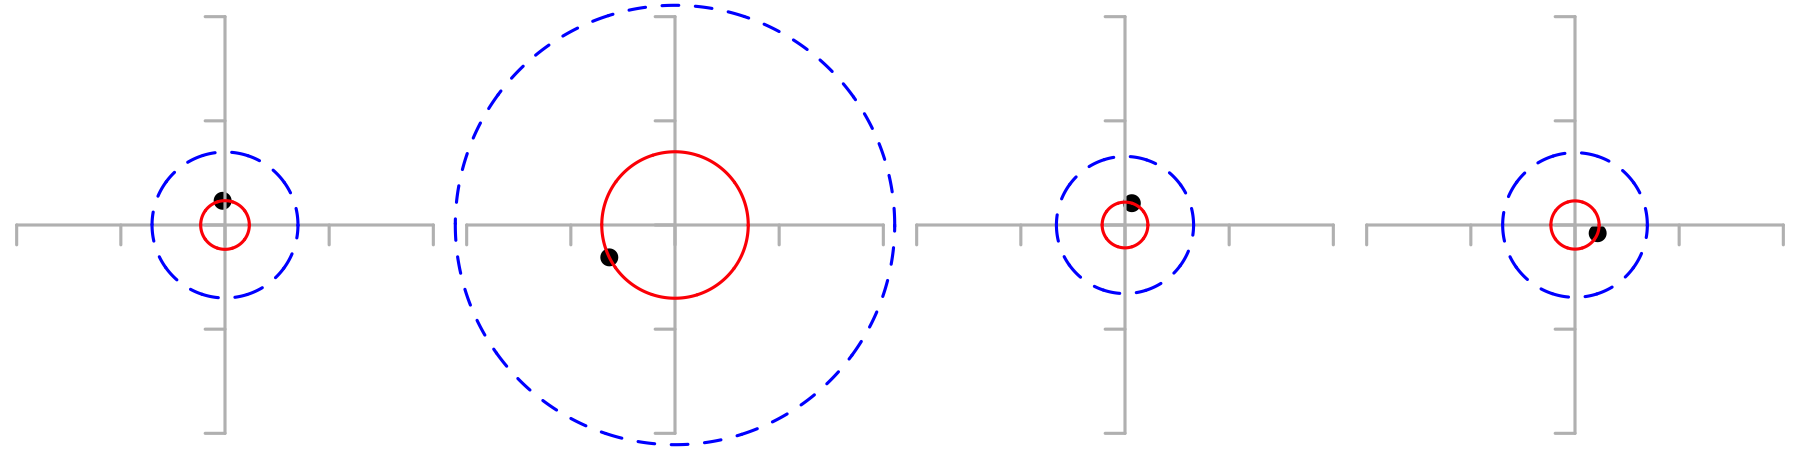
| 21:24, 22 May 2023 | SighterGroup4.png (file) |  |
33 KB | David | Sight alignment simulation with 19 shots from sigma=1, mu=0. | 1 |
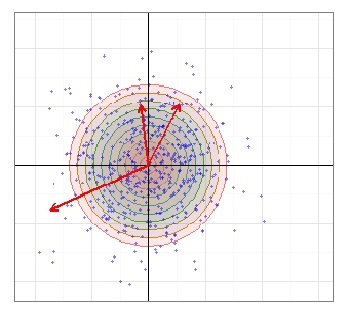
| 16:16, 8 June 2015 | Raleigh.jpg (file) |  |
33 KB | Herb | Shot a radial shot pattern around the COI. Ideally the COI would be at the POA. | 1 |
| 15:08, 2 January 2014 | CCI 40gr HV 100yd.xlsx (file) | 34 KB | David | Precision analysis of sample targets Media:40grCCI HV 100Yards String1.jpg and Media:40grCCI HV 100Yards String2.jpg | 3 | |
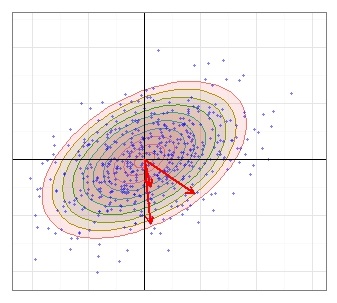
| 16:15, 11 June 2015 | Hoyt.jpg (file) |  |
34 KB | Herb | Shows distribution of shots around COI <math>\sigma_h \neq \sigma_v\text{, } \rho \neq 0<math | 1 |
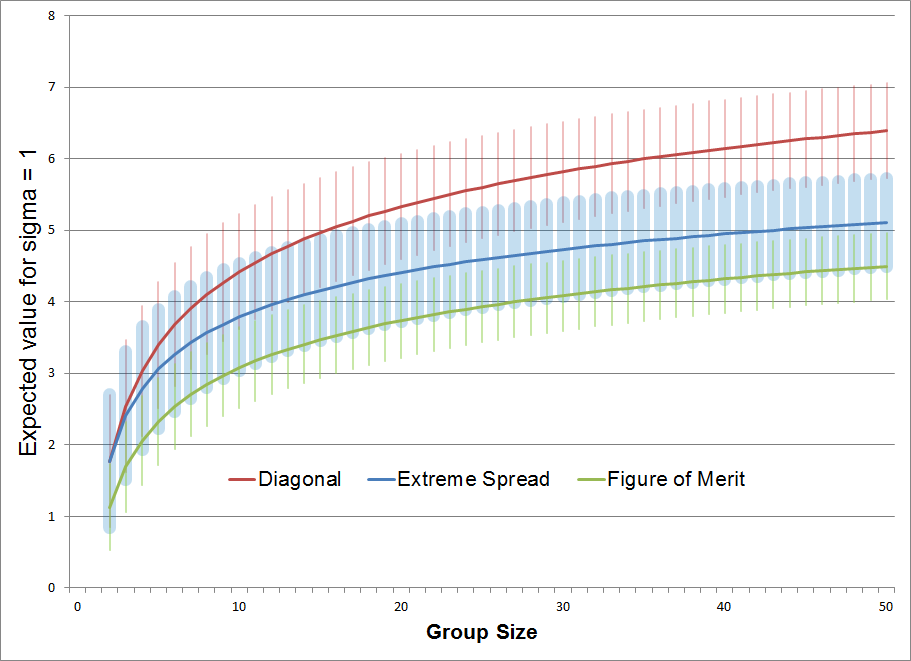
| 16:04, 20 November 2013 | SizeStatistics.png (file) |  |
34 KB | David | Graph of data from File:Sigma1ShotStatistics.ods -- expected and standard deviation of values for Extreme Spread, Diagonal, and Figure of Merit with sigma = 1, for shot groups of size 2 to 50. | 1 |
| 11:38, 18 November 2015 | 300BLK 220gr Factory Subsonic 100yd.xlsx (file) | 34 KB | David | Corrected rank adjustment plot. | 2 | |
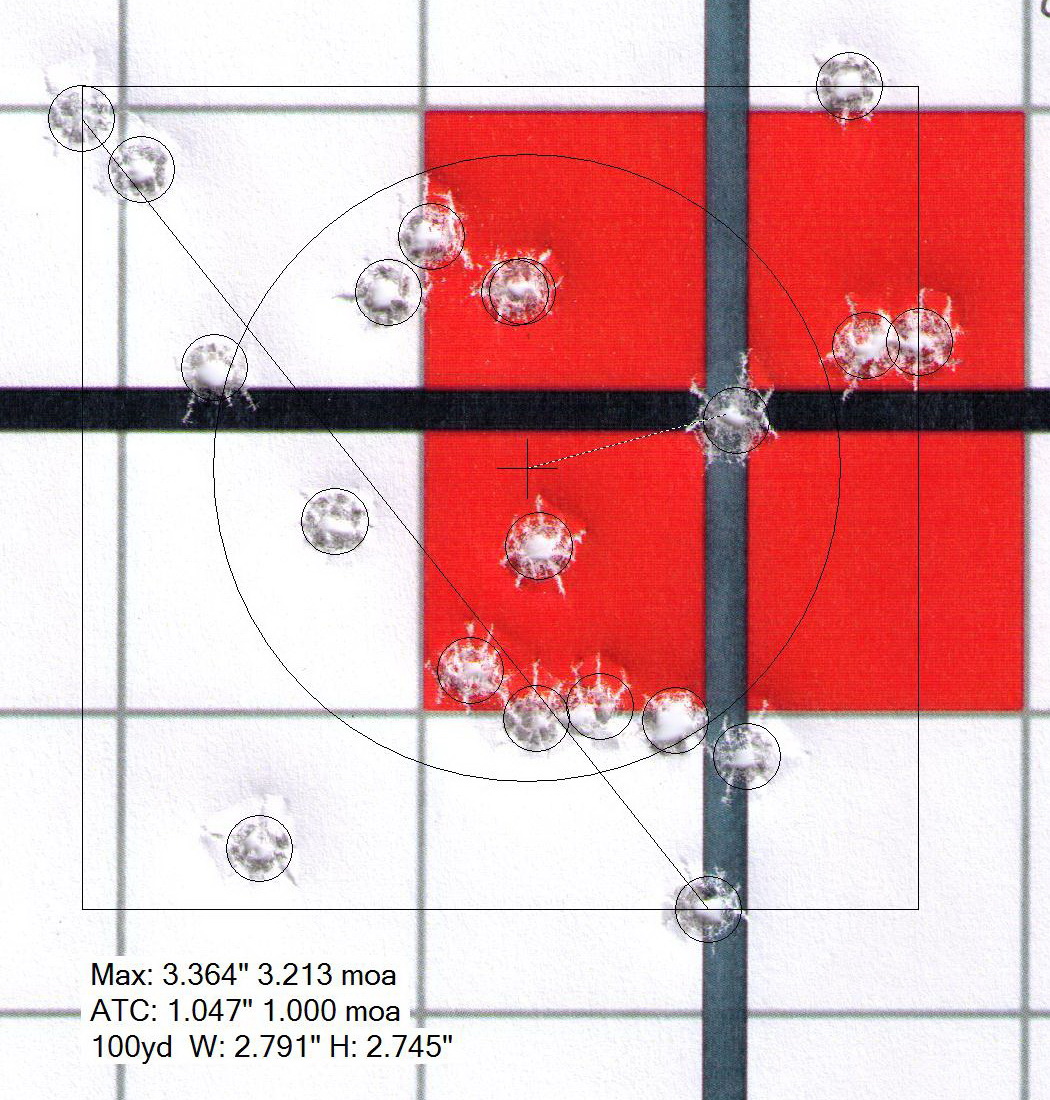
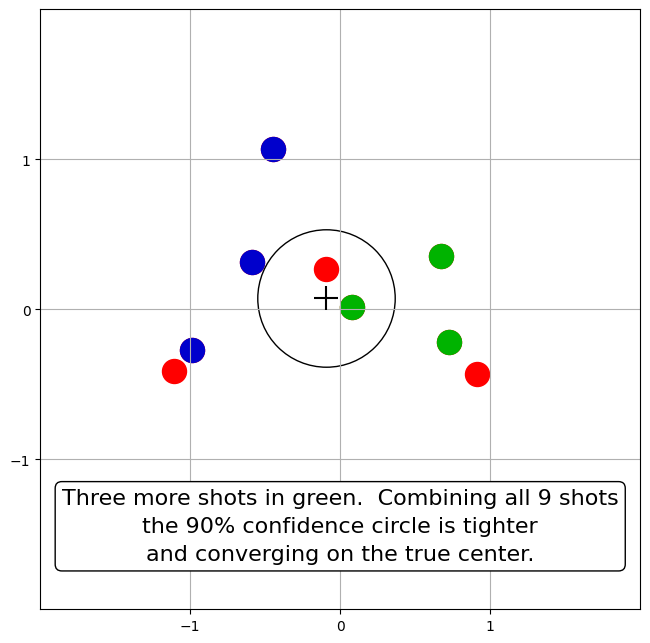
| 21:26, 22 May 2023 | SighterGroup3.png (file) |  |
36 KB | David | Sight alignment simulation with 9 shots from sigma=1, mu=0. | 1 |
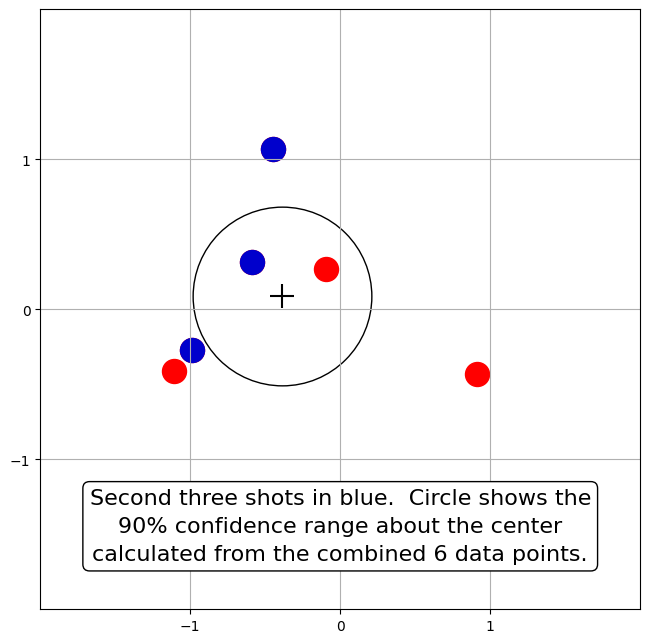
| 21:26, 22 May 2023 | SighterGroup2.png (file) |  |
37 KB | David | Sight alignment simulation with 6 shots from sigma=1, mu=0. | 1 |
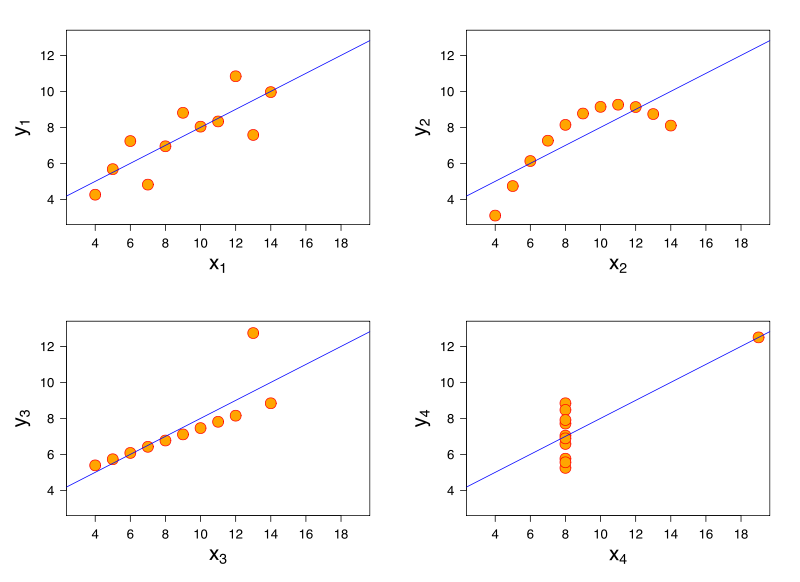
| 01:32, 11 June 2015 | 800px-Anscombe's quartet 3.png (file) |  |
38 KB | Herb | The four sets of points, [http://en.wikipedia.org/wiki/Anscombe%27s_quartet Anscombe's quartet}, have the same fit line and the same coreelation coefficient. Image from Wikipedia. http://en.wikipedia.org/wiki/File:Anscombe%27s_quartet_3.svg | 1 |
| 13:00, 30 May 2017 | BallisticAccuracyClassification.xlsx (file) | 42 KB | David | Converted to generalized sigma estimation formula for Independent Groups. | 3 | |
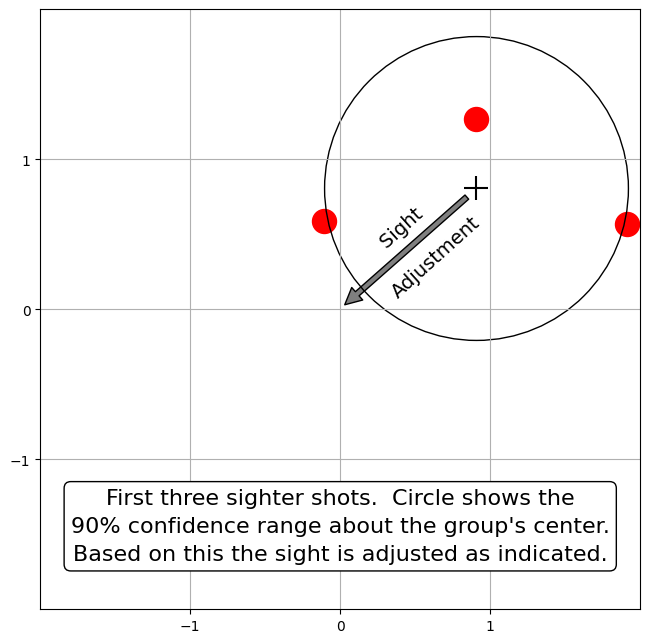
| 21:27, 22 May 2023 | SighterGroup1.png (file) |  |
51 KB | David | Sight alignment example with three shots. | 1 |
| 09:30, 5 June 2016 | OrderStatisticsFig1.png (file) | 56 KB | Louis | Order statistics examples, one shot in group | 1 | |
| 17:33, 3 February 2014 | 300BLK Subsonic Handloads 100yds.png (file) |  |
57 KB | David | 300BLK Subsonic 60-shot 100-yard Example | 1 |
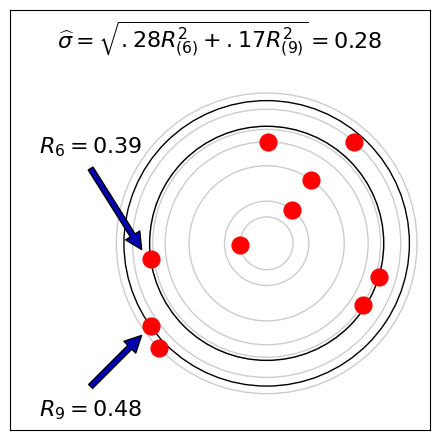
| 14:45, 30 May 2023 | 10-shotOrderStatistics1.png (file) |  |
58 KB | David | Sample target and calculation of sigma from order statistics on 10-shot group. | 1 |
| 16:19, 30 November 2014 | RangeStatisticEstimation.xls (file) | 59 KB | David | 3 | ||
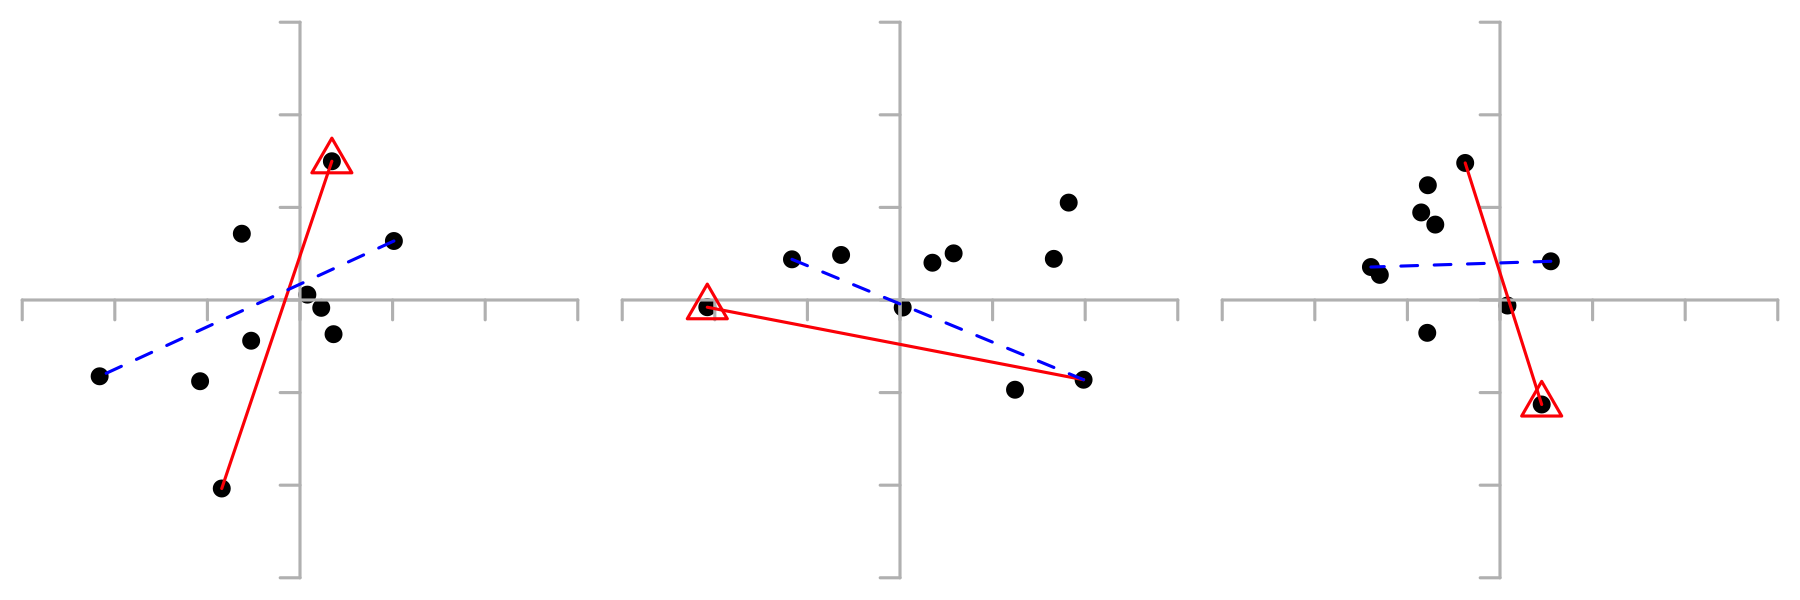
| 21:04, 7 June 2016 | Ex0-1.png (file) |  |
61 KB | Louis | Marked worst shots with red triangles | 2 |
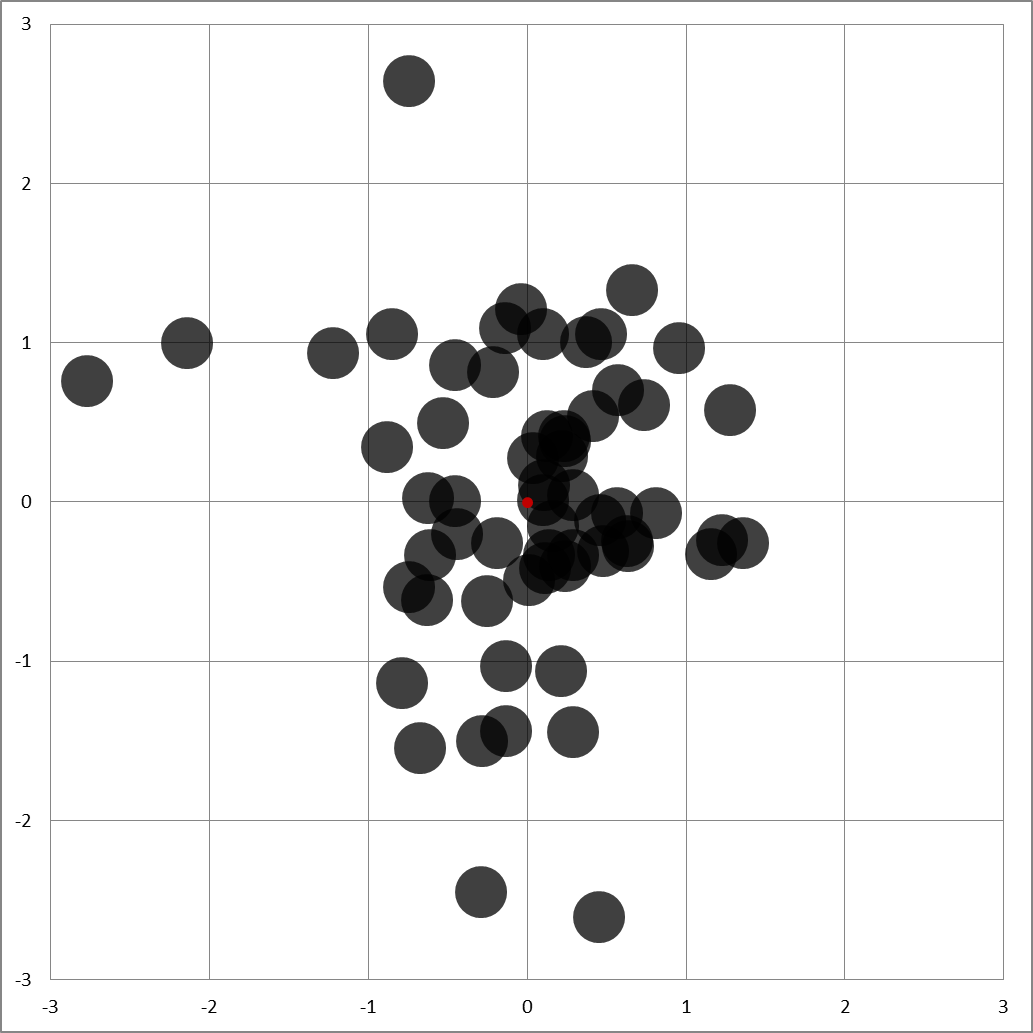
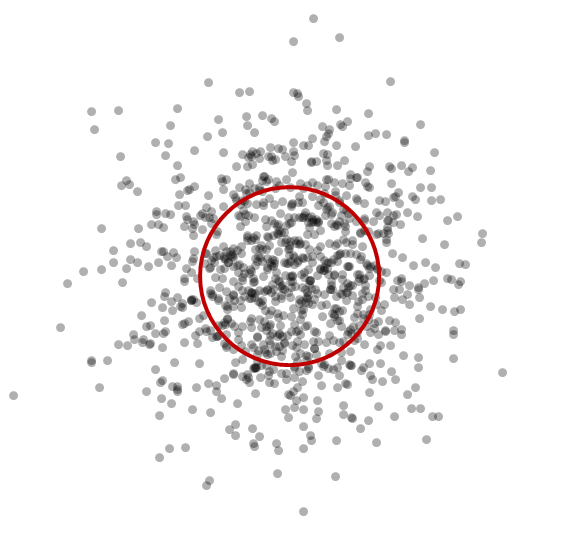
| 13:57, 21 March 2017 | 1000Shots.png (file) |  |
61 KB | David | 2 | |
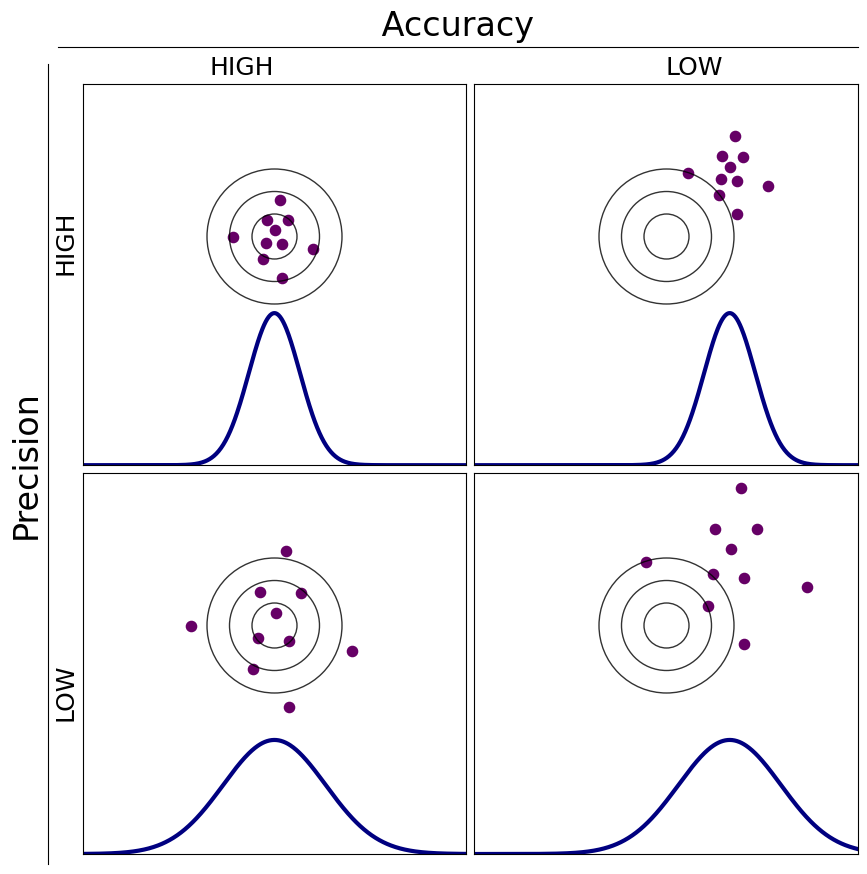
| 18:13, 18 May 2023 | Precision v Accuracy.png (file) |  |
71 KB | David | 2 | |
| 20:27, 8 June 2015 | Covering circle.jpg (file) |  |
72 KB | Herb | Red circles have a radius equal to the distance between A and B. Points in green region are: * Outside circle that has AB as a diameter * Closer to A than B * Closer to B than A | 1 |
| 09:31, 5 June 2016 | OrderStatisticsFig3.png (file) | 73 KB | Louis | Order statistics examples, three shots in group | 1 | |
| 09:31, 5 June 2016 | OrderStatisticsFig5.png (file) | 83 KB | Louis | Order statistics examples, five shot in group | 1 | |
| 13:20, 26 July 2023 | SymmetricBivariateSigma1.xls (file) | 86 KB | David | Fixed Extreme Spread Mean and StDev | 2 | |
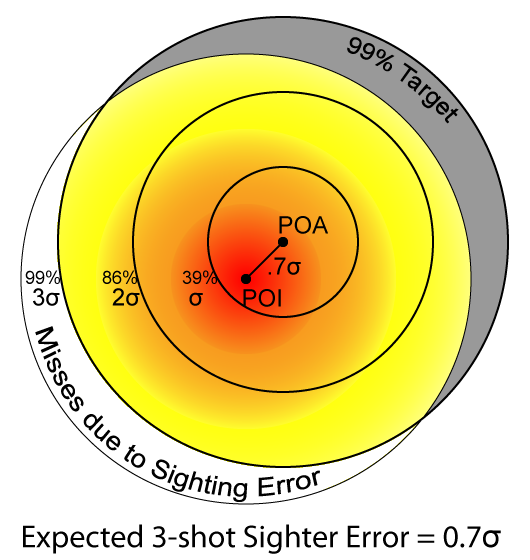
| 15:05, 3 May 2014 | 3ShotSighterError.png (file) |  |
94 KB | David | Illustration of misses on a 99% target (i.e., a target big enough that 99% of shots fired from a perfectly-sighted gun should hit it), produced by the sighting error expected from using a 3-shot sighter group. | 1 |